The 2025 Macro Reset: Liquidity, Tariffs & the Road Ahead
Apr 09, 2025
The Macro Truth: Why Markets Are Down Now & Why That’s About to Change
Over the past few weeks, markets have been brutal.
-
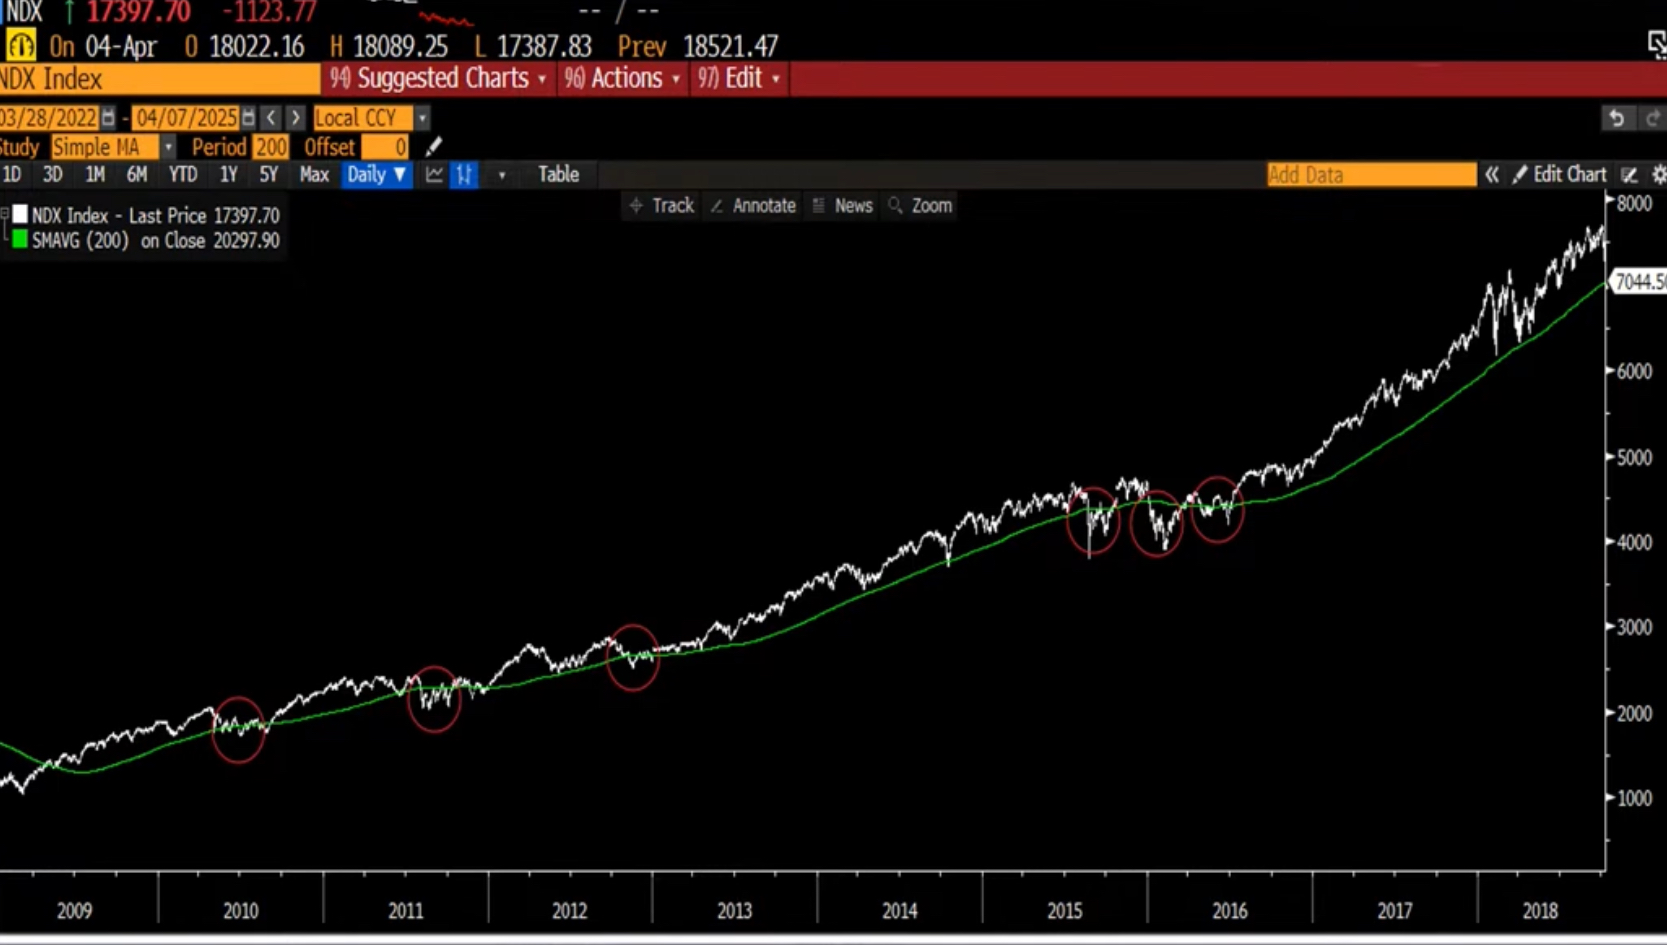
The Nasdaq 100 (NDX) has dropped sharply, nearing its 200-day simple moving average (SMA), a key long-term support level.
-
The S&P 500 is pulling back.
-
Many tech stocks are down 10-30%.
-
Crypto is bleeding, with some tokens down 20-60%+ from recent highs.
It feels like we’re entering a recession. But what’s really going on? If you look beneath the surface, the data paints a very different story.
Why This Is Happening (And Why It’s Not What You Think)
This current market downturn is a delayed response to Q4 2024's financial tightening. Historically, there is about a 3-6+ month lag between monetary policy moves (such as interest rate hikes, balance sheet reductions, and tightening credit conditions) and their full effect on the economy and markets.
In other words, what you're seeing today was set in motion months ago. The economic and market pain we feel in early 2025 is the consequence of decisions made in late 2024.
In addition to these lagging effects, we are also seeing a flurry of short-term catalysts that add fuel to the fire:
-
Escalating rhetoric around tariffs and trade wars, especially with China
-
Political uncertainty with a new president entering office
-
Headlines amplifying Federal Reserve hawkishness, despite underlying macro weakness
This combination of lagged tightening + headline fear has created a perfect storm of emotional selling, despite the macro data showing early signs of expansion.
The Oversold Setup: What Happens at the 200-Day Moving Average
Historically, when the Nasdaq 100 (NDX) touches or dips below its 200-day simple moving average (SMA), it marks a high-probability reversal zone. Since the 2009 global financial crisis, there have only been six such occurrences. In nearly every case, these dips were followed by strong rallies in the months that followed.
Why does this happen? Because:
-
Institutional buyers often step in at major technical levels
-
Short positions begin to cover
-
Oversold sentiment begins to reverse
These setups typically occur right before the macro environment begins to reflect easing or recovery
Right now, the NDX, S&P 500, and crypto markets are all near major technical support, and from a positioning standpoint, this is where opportunities begin to form for forward-looking investors.
The Global Liquidity Game: Tariffs, Currency Pressure, and the Dollar Web
While the media portrays trade wars and tariffs as political fighting, the reality is far more strategic. What we’re watching is a global negotiation over liquidity and currency value, with the dollar at the center.
Here’s how it works:
1. China Needs a Weaker Dollar
-
China’s economy is export-dependent. A strong U.S. dollar causes the Yuan to strengthen (due to its managed peg), which makes Chinese goods more expensive and reduces global demand.
-
Additionally, China has substantial U.S. dollar-denominated debt. A strong dollar makes servicing that debt more expensive in Yuan terms, effectively draining liquidity from the system.
-
This creates pressure on China’s financial system and slows their internal stimulus efforts. For China to recover and provide global momentum, they need dollar weakness and global liquidity relief.
2. Japan Provides Global Liquidity
-
Japan, through the Bank of Japan (BOJ), has kept interest rates at or near zero for decades. This policy creates an international carry trade, where institutions borrow cheaply in yen and invest in higher-yielding global assets.
-
This capital outflow from Japan serves as a liquidity pipeline to the rest of the world.
-
As long as Japan maintains low rates, it continues to inject fuel into global financial markets, supporting U.S. stocks, tech, and even crypto.
3. Europe’s Role
-
Europe, particularly the European Central Bank (ECB), has mirrored Japan’s dovish approach until recently. However, Europe’s system is more fragile due to the structural weaknesses of its banking system.
-
When the dollar strengthens too aggressively, European banks face liquidity stress, as many of their liabilities are in USD. This can lead to dollar shortages and require central bank intervention (e.g., Fed swap lines).
4. The Tariff Bluff
-
The U.S. uses tariff threats not as a true economic weapon, but as a bargaining chip.
-
These threats apply pressure on other nations (particularly China) to accept new trade deals that ultimately allow the dollar to weaken and unlock liquidity.
-
It’s a geopolitical poker game: threaten tariffs, create volatility, then use that fear to negotiate a currency and trade setup that benefits all sides.
Flashback to the Shanghai Accord (2016)
In early 2016, global markets were struggling. The U.S. dollar was surging. China was experiencing significant capital outflows, and emerging markets were collapsing under the pressure of dollar debt.
To prevent a larger crisis, global central banks convened at the G20 summit in Shanghai. Though it wasn’t publicly declared as a formal accord, what followed was a clear coordinated effort to weaken the dollar and restore global liquidity.
Outcomes of the Shanghai Accord:
-
The dollar reversed and weakened
-
Commodities bottomed and began rallying
-
Crypto entered a new bull cycle
-
Equity markets rebounded strongly
Today’s macro landscape is showing eerie similarities. The dollar had been rising, global liquidity was tight, and trade war noise is building. We are likely headed toward another informal, behind-the-scenes agreement that resets the global balance.
Are We Headed Into a Recession? Macro Says No.
One more reason rates will need to drop? We need to service our debts. With national debt levels at all-time highs, the cost of servicing that debt becomes increasingly unsustainable at elevated interest rates. The usual solution? Lower rates and refinance into cheaper debt.
This is how sovereign systems maintain balance without triggering a debt spiral. As pressure mounts, rate cuts become not just a choice, but a necessity.
Contrary to what many believe, the indicators suggest we are exiting a recession, not entering one. Let’s examine the data:
Global M2 is Rising
-
Global money supply (M2) has begun to expand again, especially across Asia and emerging markets.
-
Historically, risk assets (S&P 500, Nasdaq, crypto) are highly correlated to global M2 (see charts below)
- This is also mirroring 2016-2017 markets
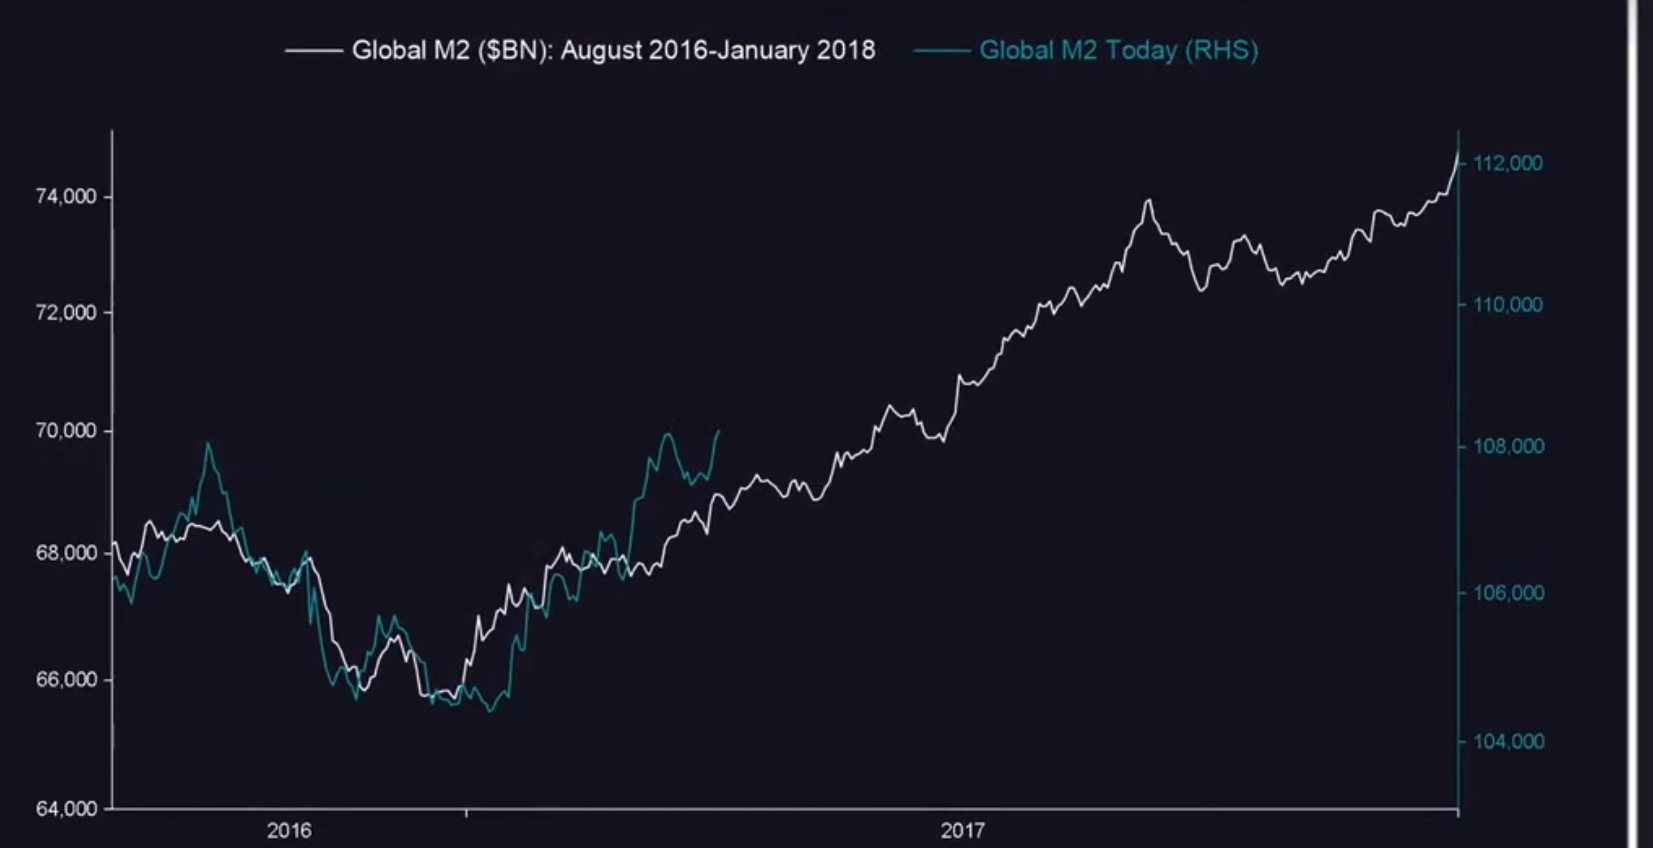
(global M2 mirroring 2016-2017 market)
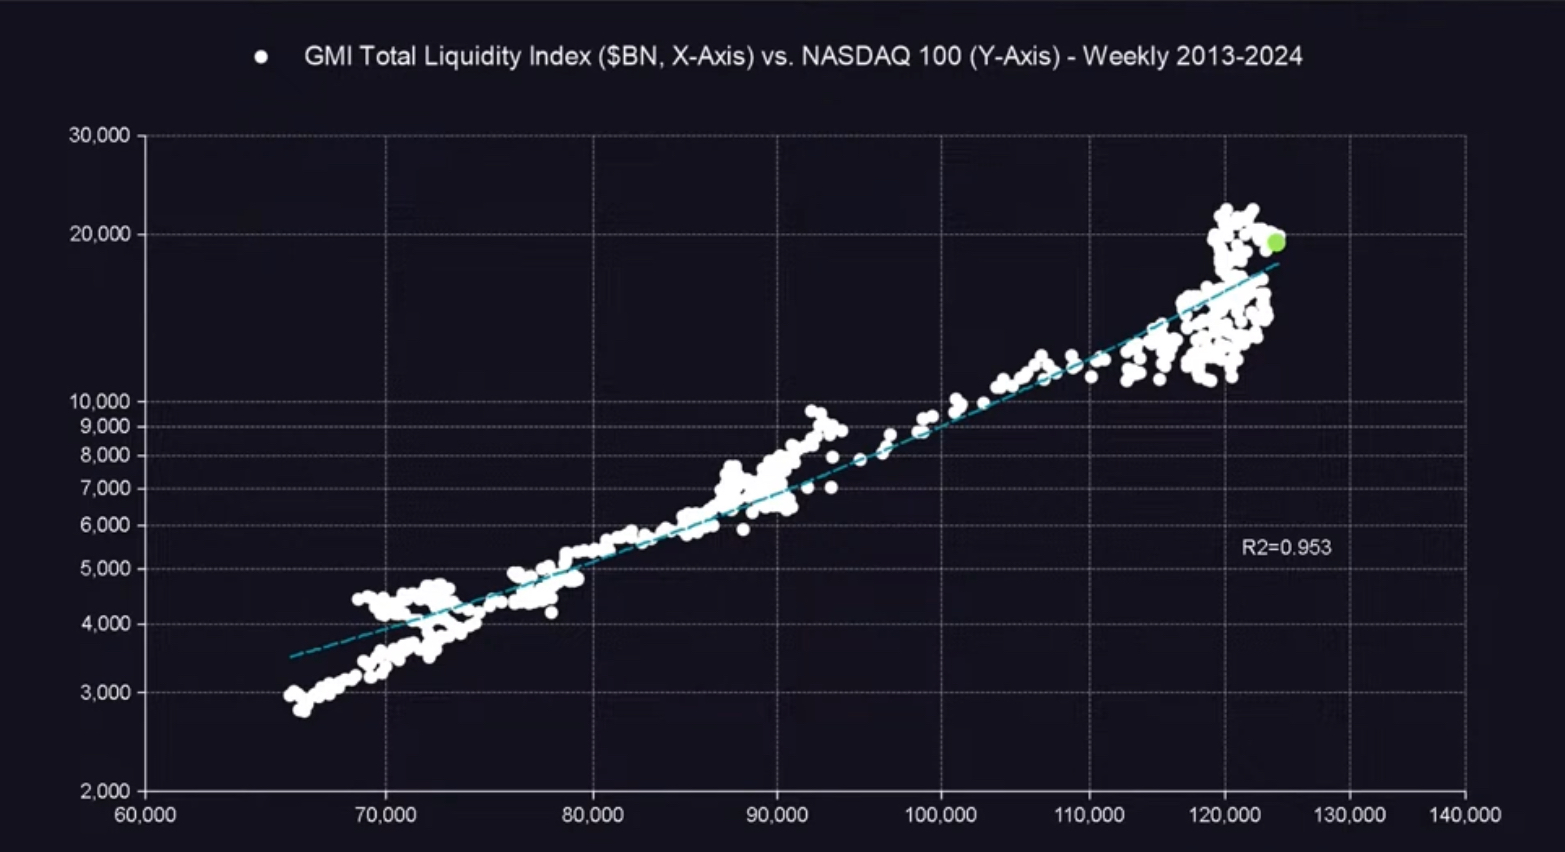
(strong correlation of NASDAQ and Total Liquidity with R2= 0.953)
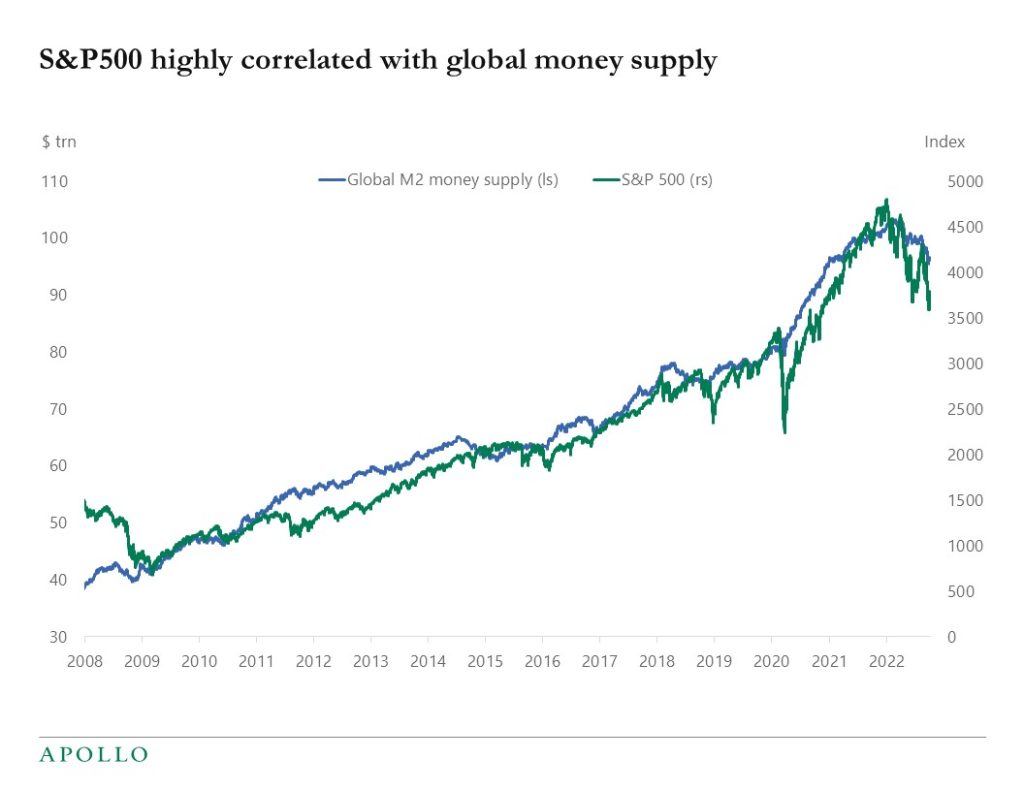
(SP500 highly correlated to Global M2 - 97-98%)
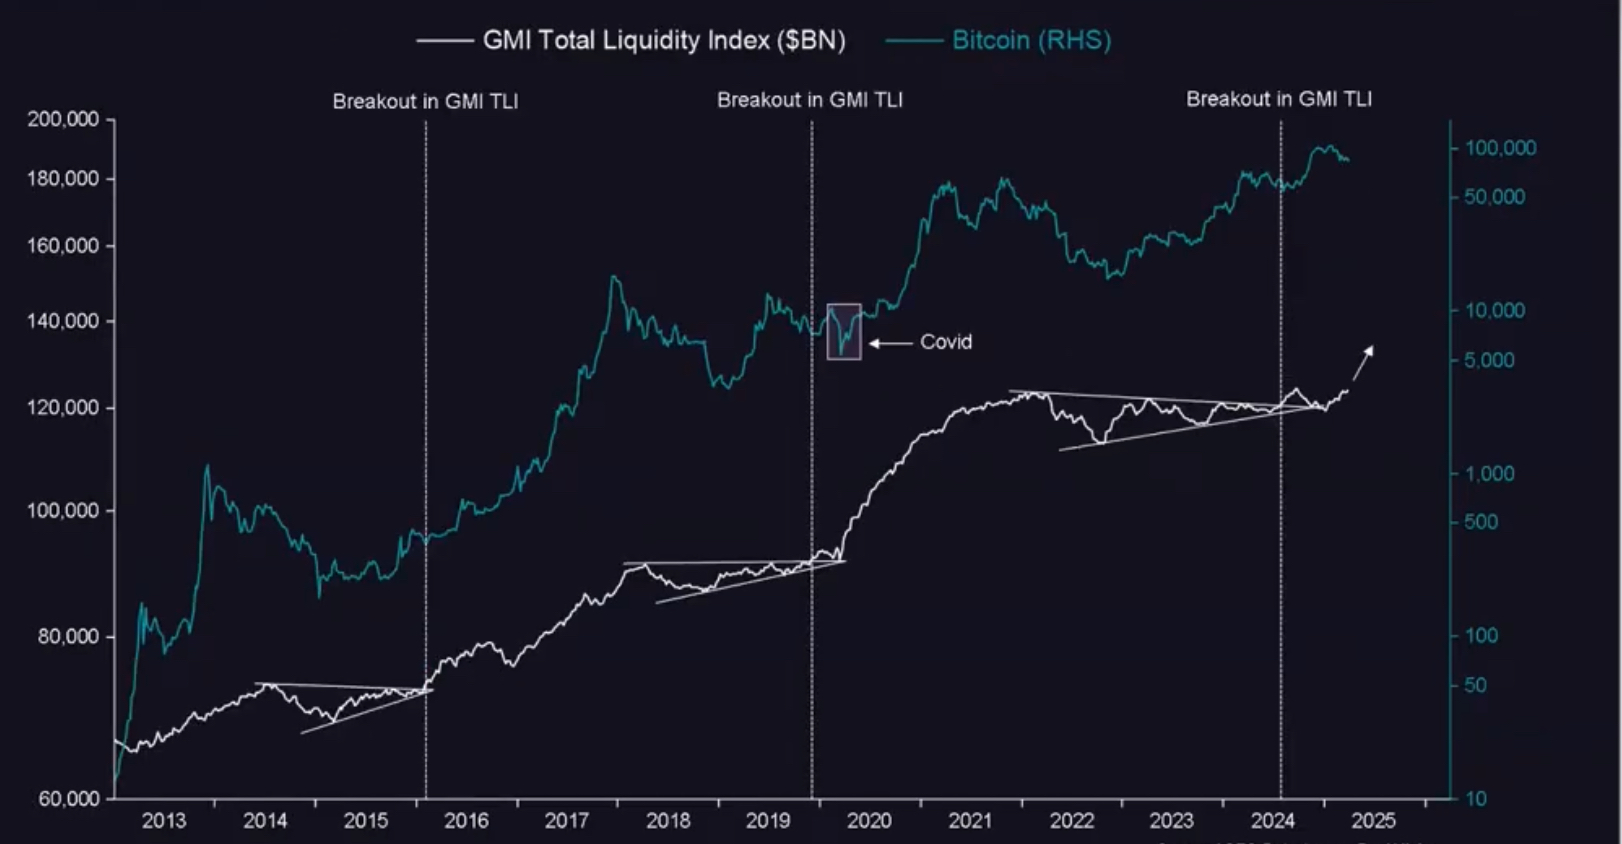
(Bitcoin also shows high correlation of to Total Liquidity)
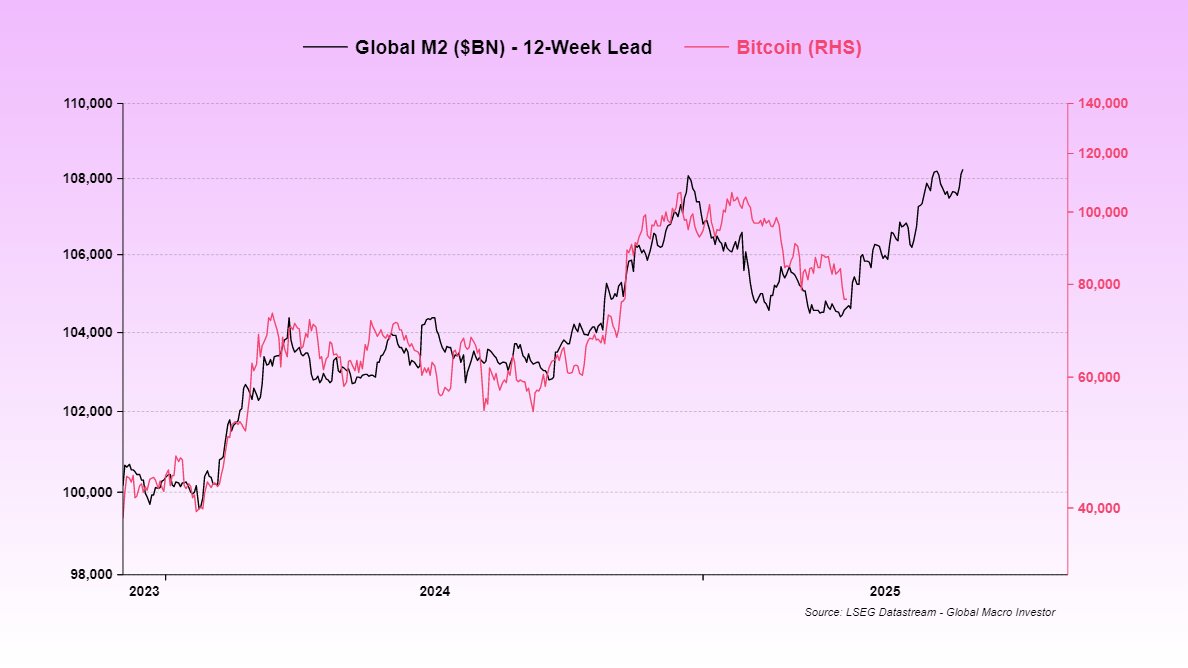 (Bitcoin shows high correlation to M2 movements)
DXY is Declining
-
The U.S. Dollar Index (DXY) has begun trending downward.
-
A weaker dollar supports global liquidity, boosts emerging market assets, and reduces debt stress globally.
- Note DXY is also mirroring what happened in 2016-2017
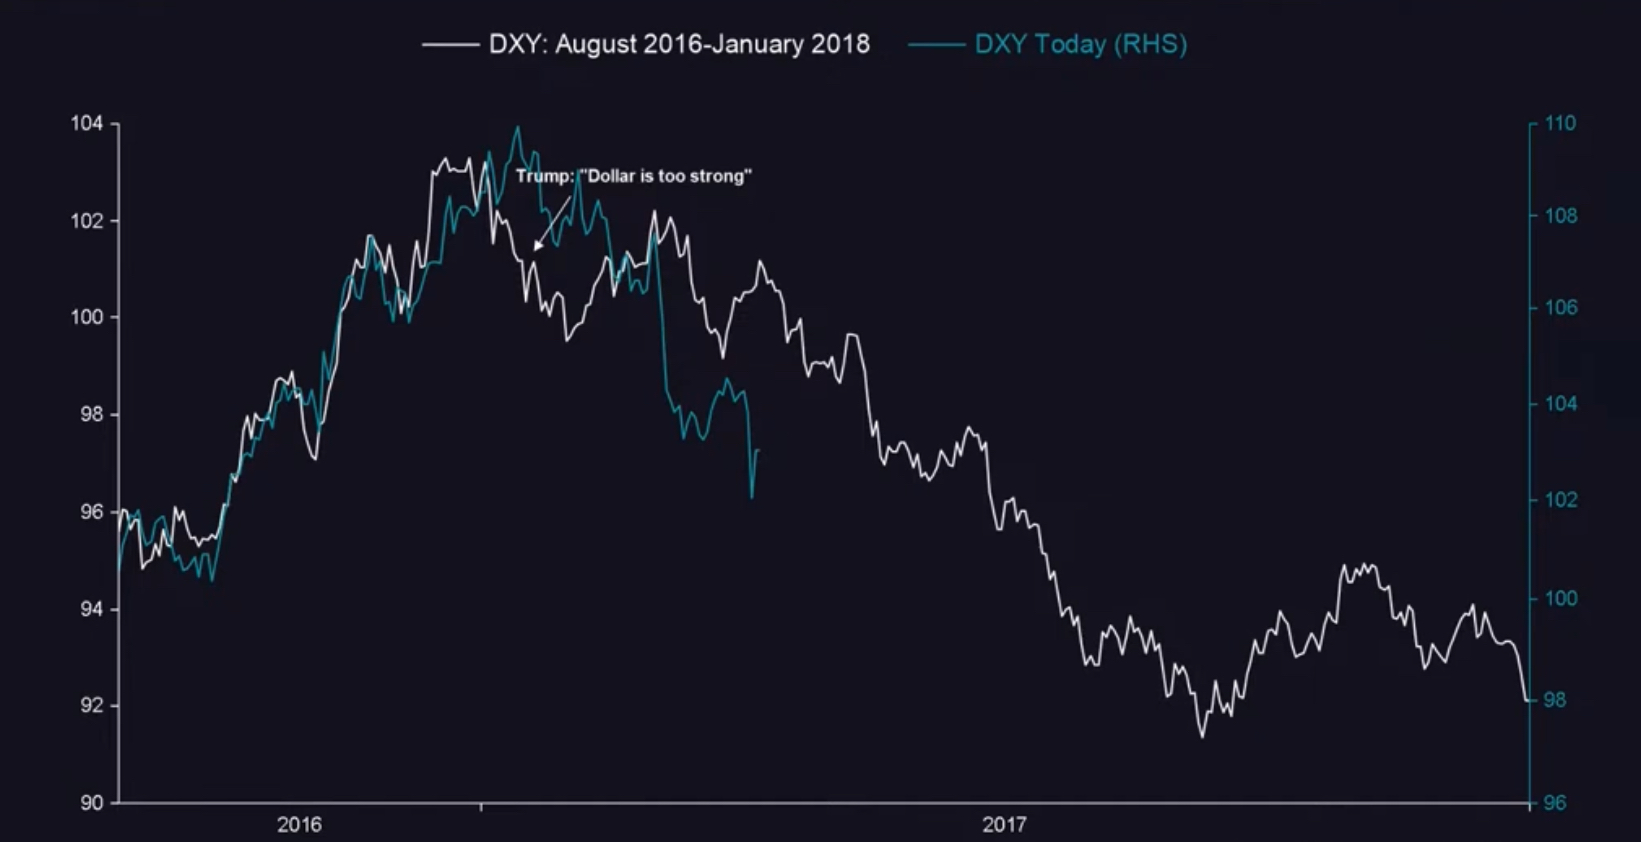
(similar DXY setup as 2016/2017)
ISM/PMI > 50
-
The ISM Manufacturing Index crossed above 50 in February — a key line between contraction (<50) and expansion (>50) (see chart below)
-
This soft data leads hard data. Historically, ISM upturns precede major market rallies by 3-6 months and up to 9 months.
- While its been hovering below and above 50 the general trend is an upward movement and doesn't seem to be taking on new lows
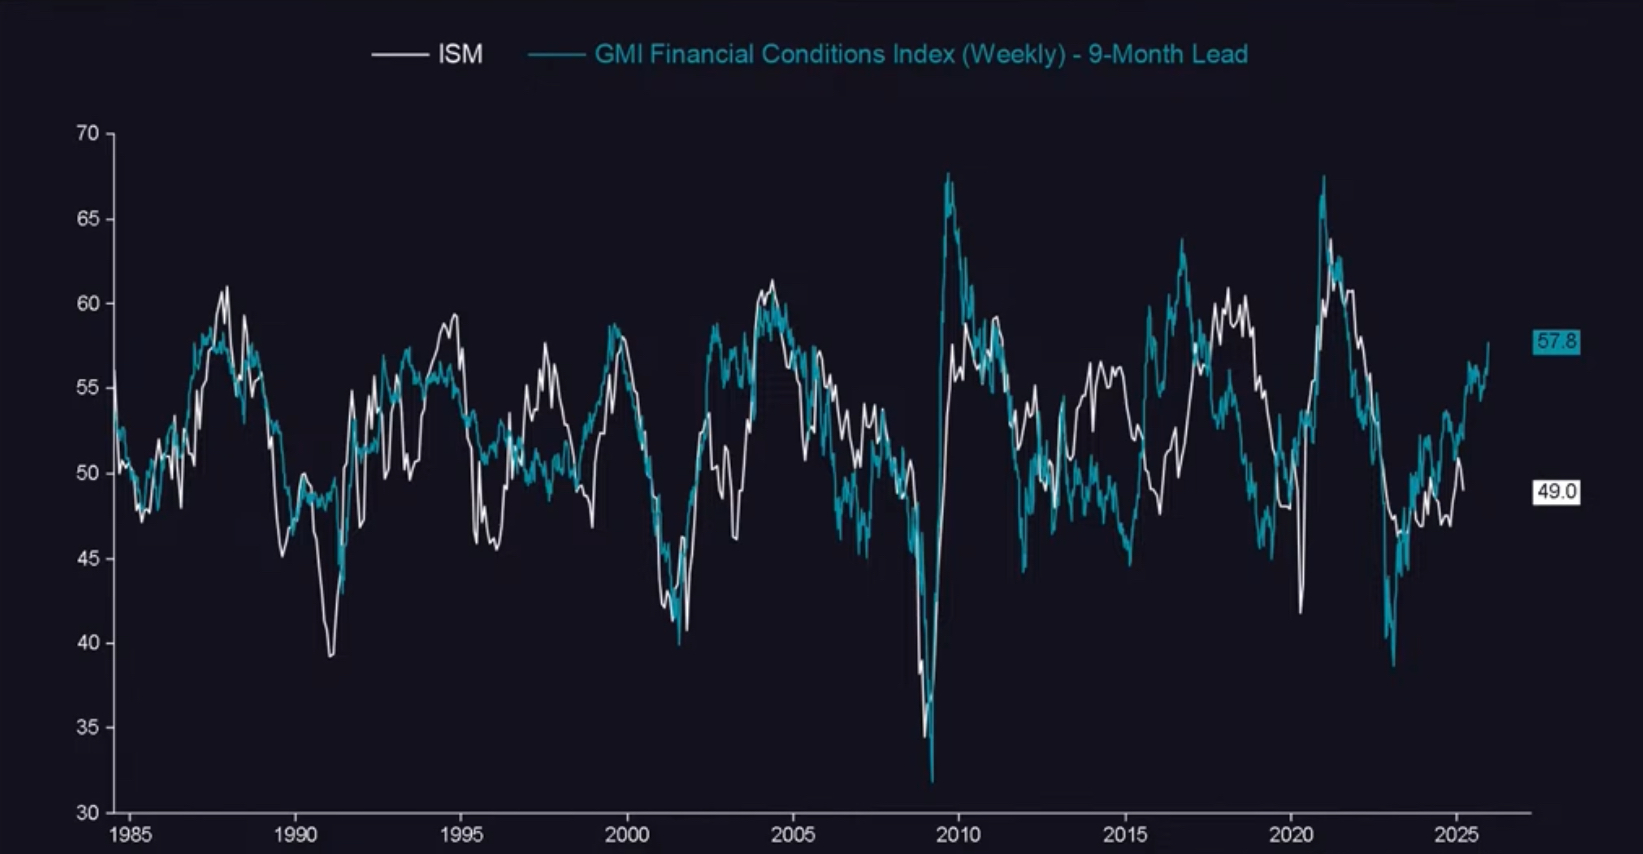
(relationship of ISM and Finacial Conditions with 9mo lead)
We've Been in a Recession Already (And Are Coming Out Of One)
-
Many believe we’re heading into a recession, but in reality, we’ve already been through one over the past 18-24 months (See PMI/ISM chart above)
-
Financial markets always lead the economy. The pain felt on Main Street lags behind Wall Street’s pricing.
All this points to an early-stage expansion, not a looming crash.
The Big Macro Picture: Demographics, Debt, and Debasement
One of the clearest long-term relationships in macro is the inverse correlation between aging populations and government debt as a percentage of GDP. As the working-age population declines, fewer people contribute to economic output while more draw on social programs and retirement benefits. The result? An ever-growing debt load that must be funded.
This is something you'll hear echoed often in macro circles: "As the population ages, government debt must rise to maintain the illusion of growth." That’s not because governments are irresponsible—it’s because the system demands it.
An aging demographic base equals lower labor force participation, which in turn leads to lower productivity and growth, forcing governments to turn to debt issuance just to keep the machine running., which in turn leads to lower productivity and growth, forcing governments to turn to debt issuance just to keep the machine running.
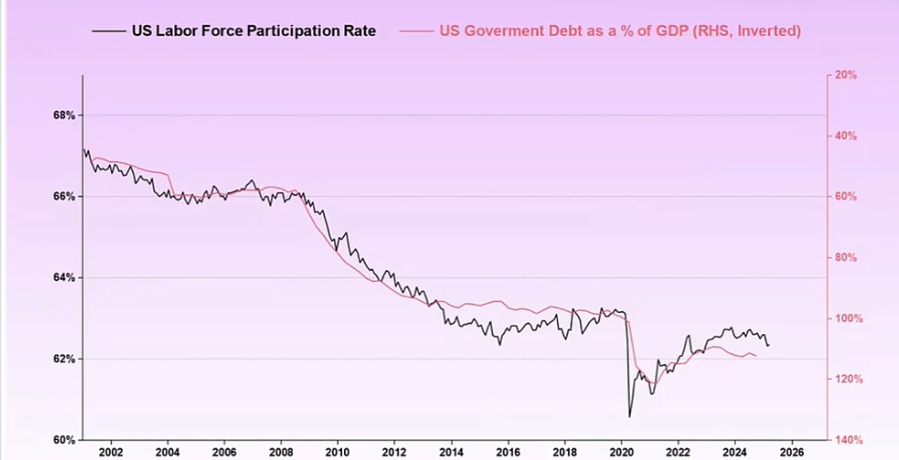
(Aging demographics is the big macro trend that is fueling our debt growth)
The chart is striking:
-
As labor force growth slows, government debt as % of GDP rises in near-perfect inverse correlation.
-
It’s not random—it’s systemic.
And that’s why debasement isn’t just a trend—it’s the framework. Without a productivity boom or population growth surge, more liquidity and more debt is the only path forward.
The ultimate driver of long-term macro is not just policy or headlines — it's demographics.
The GDP Equation
GDP = Population Growth + Productivity Growth + Debt Growth
Right now:
-
Population growth is slowing (aging societies across developed nations)
-
Productivity growth has stagnated
-
The only remaining lever? Debt-fueled growth via liquidity injections
From WWII To Today (How We Got Here)
After WWII, economies were devastated, and population growth had cratered. Not a good time for GDP (think GDP equation)
Then came the baby boomers, which fueled a resurgence in demand, labor, and production.
In the 70s and 80s, that surge caused massive inflation, as boomers competed for the same jobs, homes, and cars.
To combat the major structural shifts that were occurring due to wage-price spirals, union powers, and loose monetary policy, Paul Volcker initiated what was to be known as the "Volcker Shock".
Appointed by Jimmy Carter, Paul Volcker the appointed Federal Reserve Chairman took on a highly aggressive approach to this rapid inflation with high interest rates peaking as high as 20%.
While it helped curb that rapidly increasing inflation, it induced an economic recession.
90s & 2000s
The 90s and 2000s was the era of:
- Falling interest rates
- Stable inflation
- Massive rise in private and public debt
It was the golden age for asset prices as stocks, bonds and real estate began to explode in value.
At this time baby boomers moved from being inflationary (as spenders) in the 70s to being disinflationary (as savers/investors) in the 90s.
This further increased capital availability and led to a long period of economic growth without high inflation. Add in globalization of countries like Eastern Europe and china the markets were suddenly flooded with cheap labor keeping inflation continually low for quite a period of time.
While the 60s & 70s solved the GDP equation temporarily through population growth , the 90s and 2000s saw a shift to productivity-driven growth, powered by globalization and technology. Low rates and growing debt marked the financialization of the system with increased use of leverage and increased reliance on central banks to backstop downturns.
But this too faded by the 2008 financial crisis, when excessive leverage led to a systemic collapse.
The Shift: The Liquidity Era
The 2008 Global Financial Crisis forced policymakers to rewrite the rules of finance. Instead of allowing mass defaults and deleveraging, they began shifting private and public debt onto central bank balance sheets.
This ushered in a new paradigm: The Liquidity Era.
Here’s how it works:
-
Central banks inject liquidity through asset purchases, QE, and low interest rates
-
This liquidity supports financial markets, raises asset prices, and maintains economic stability
But here's the catch:
-
This growth is not real productivity or output-based
-
It is driven by monetary debasement
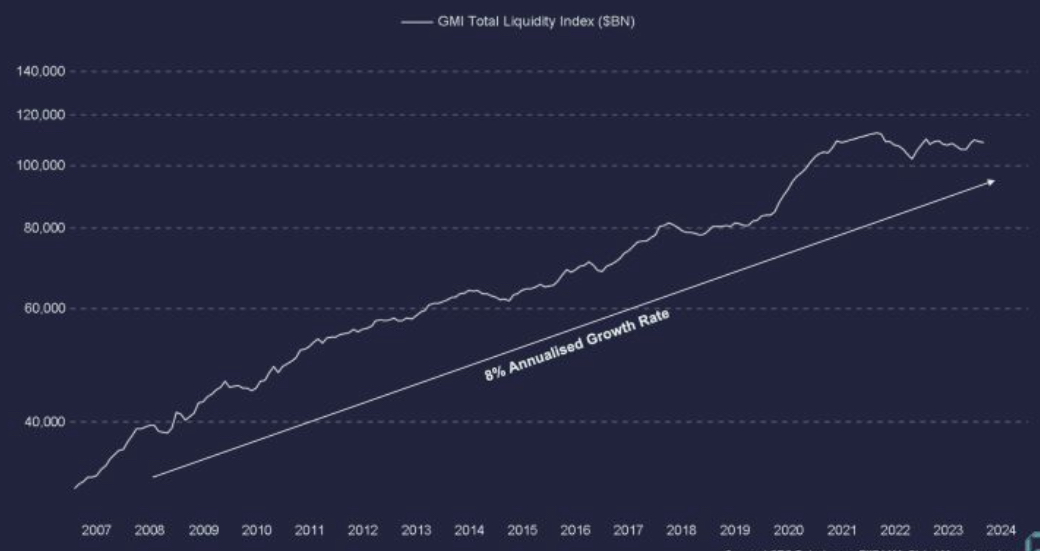
(average of 8% debasement of currency since 2007)
Over the past 15+ years, we’ve seen average global debasement of around 8% per year. That means:
-
The value of money is being diluted
-
Assets (stocks, real estate, crypto) appear to rise, but in real terms, they're often just keeping up with liquidity flows
For the average person, this has massive implications:
-
If your money isn’t earning at least 8% annually, it’s losing purchasing power.
-
Add in 2-4% inflation, and your true hurdle rate is 10-12% just to stay financially flat.
📉 Let’s break that down:
-
If you have $100,000 sitting in a savings account earning close to 0%, and you're losing value at 10% per year...
-
In just 3 years, that $100,000 will have the buying power of only ~$73,000
This is why simply saving cash isn’t enough anymore. You have to be invested in productive assets just to preserve wealth, let alone grow it.
This is why it feels like asset prices go up endlessly, while purchasing power stagnates for most people. The system is designed this way:
-
Governments keep GDP rising by increasing nominal figures (via more liquidity)
-
Individuals feel wealthier as their 401(k), home, or crypto portfolio rises
-
But behind the scenes, that "growth" is often optical, not functional
It’s a necessary illusion to prevent collapse under the weight of aging populations, slowing productivity, and massive debt.
Until we find a new productivity boom or population surge, debasement will remain the primary tool to support markets, pensions, and global economic stability.
What To Do Right Now
Macro can’t time the exact bottom, but it does show the direction of the current.
All indicators point toward a bullish setup forming now, with real momentum expected around May 2025 and beyond:
-
Technicals are oversold (NDX near 200SMA)
-
Global M2 is rising
-
The dollar is weakening
-
ISM is above 50 and climbing
Yes, there will be volatility. But the macro tide is shifting.
✅ Hold your positions if you’re already invested
✅ Don’t panic sell unless absolutely necessary
✅ Consider dollar-cost averaging into risk assets if underexposed
This is how macro turns.
Slowly. Then all at once.
Final Thoughts: Where We Go From Here
The markets are evolving fast—and the rules are changing just as quickly. But you don’t have to navigate this new landscape alone.
Over the last decade, I’ve helped hundreds of high-performing professionals—from CEOs to entrepreneurs—transform not only their wealth but their mindset, energy, and lifestyle. Whether you're looking to build long-term financial freedom through real estate, stocks, crypto, or you're just tired of spinning your wheels and want a clear plan forward… I’ve been in your shoes. I went from paycheck to paycheck to building a 7-figure net worth and accomplishing 40 rental properties and flips while living life on my own terms. Now, I help others do the same.
If you’re ready to start building lasting wealth and take advantage of what’s ahead—not fear it—here are a few next steps:
🔹 Explore My Free Tools & Resources:
Get instant access to my vault of free guides, strategy trainings, and cheat sheets to start leveling up now.
👉 www.shaunsurgener.com/free-resources
🔹 Book a Free Strategy Call:
Want to talk through your goals, situation, or investment game plan? Let's dive in. This is a no-pressure value call to help you gain clarity and momentum.
👉 www.shaunsurgener.com/bookacall
🔹 Learn More About My Coaching & Story:
Discover how I help high-performers master their mindset, money, and physique—so they can create true freedom.
👉 www.shaunsurgener.com/about
If you’re serious about building real wealth in a world that’s changing fast—I’m here to help you win.
Let’s make this your breakthrough year.
— Shaun Surgener

Join Our Mailing List
Subscribe to our newsletter to receive the latest news and updates straight to your inbox
We hate SPAM. We will never sell your information, for any reason.